Post-processing software options
Depth plot
To quantitatively analyze the inner tissue, align at the surface and calculate an average value at each depth.
Example: Rice degradation
OCT Intensity was higher in degraded rice at deep regions than in normal rice, allowing quantitative comparison.
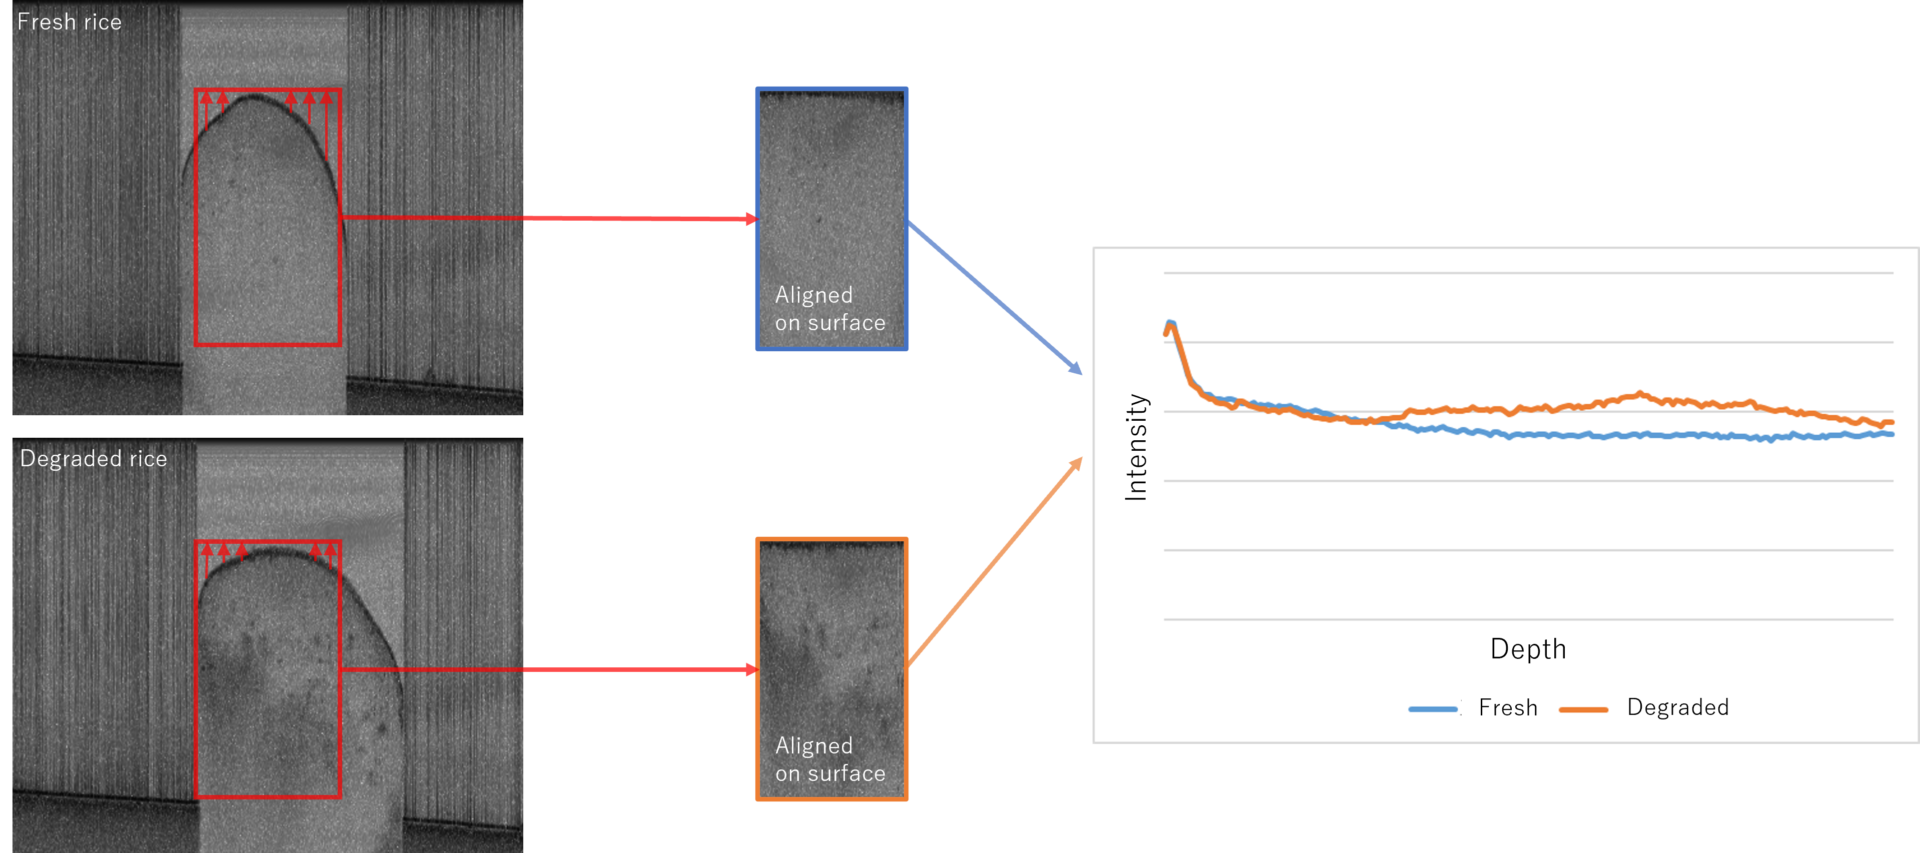
※In addition to rice, it has broad applicability to vegetables, fruits, skin, etc.
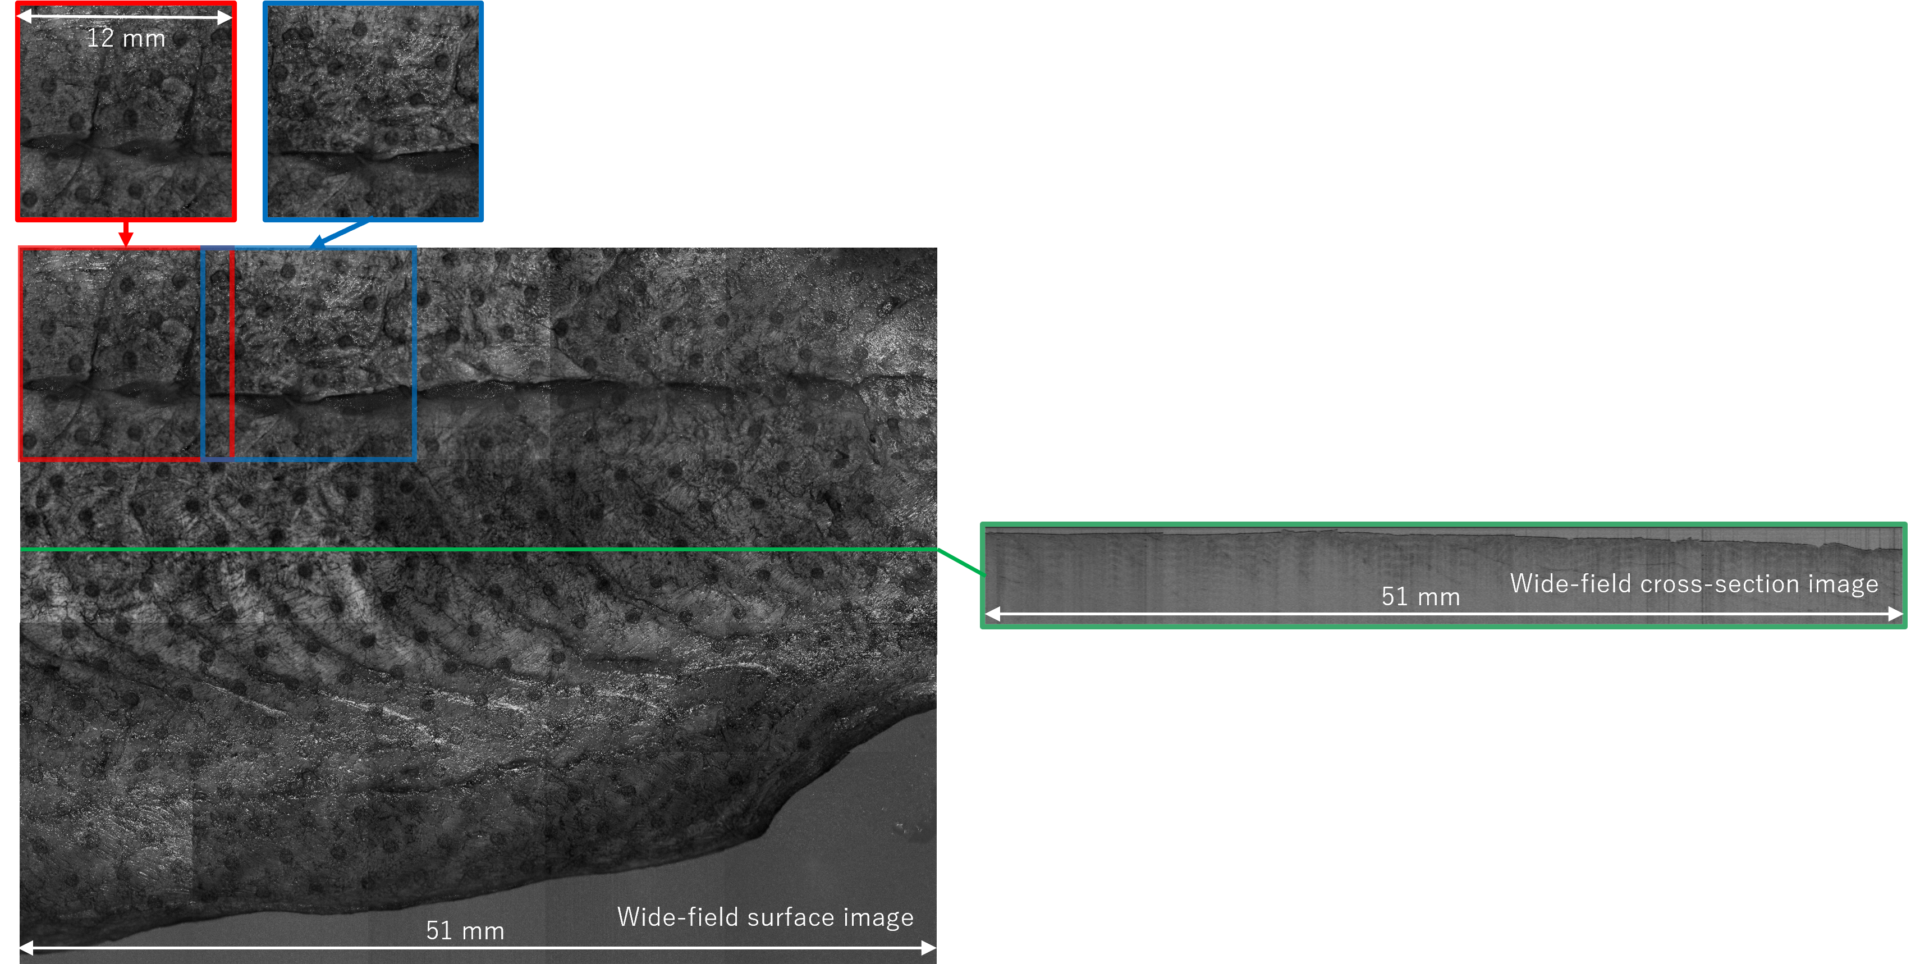
2D registration
Combines multiple OCT images measured at different locations to generate a wide-field image.
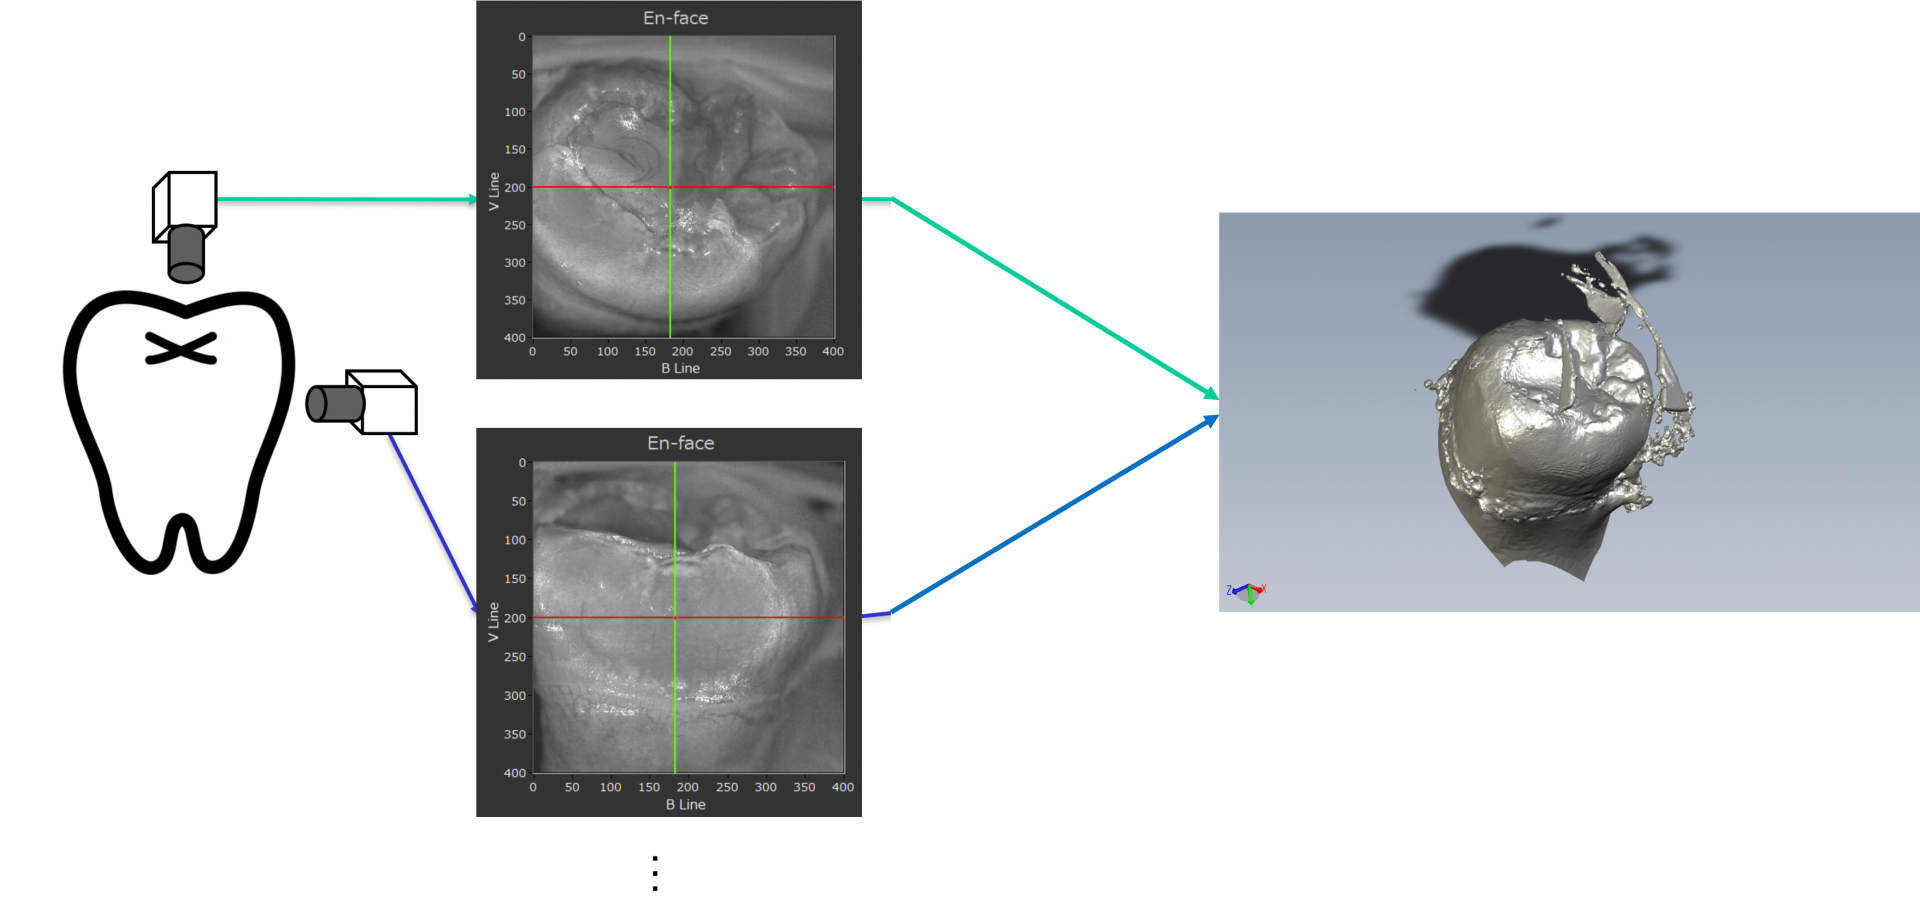
3D surface registration
Generate a 3D-CAD (STL file) of the surface profile using multiple OCT images measured from different angles.
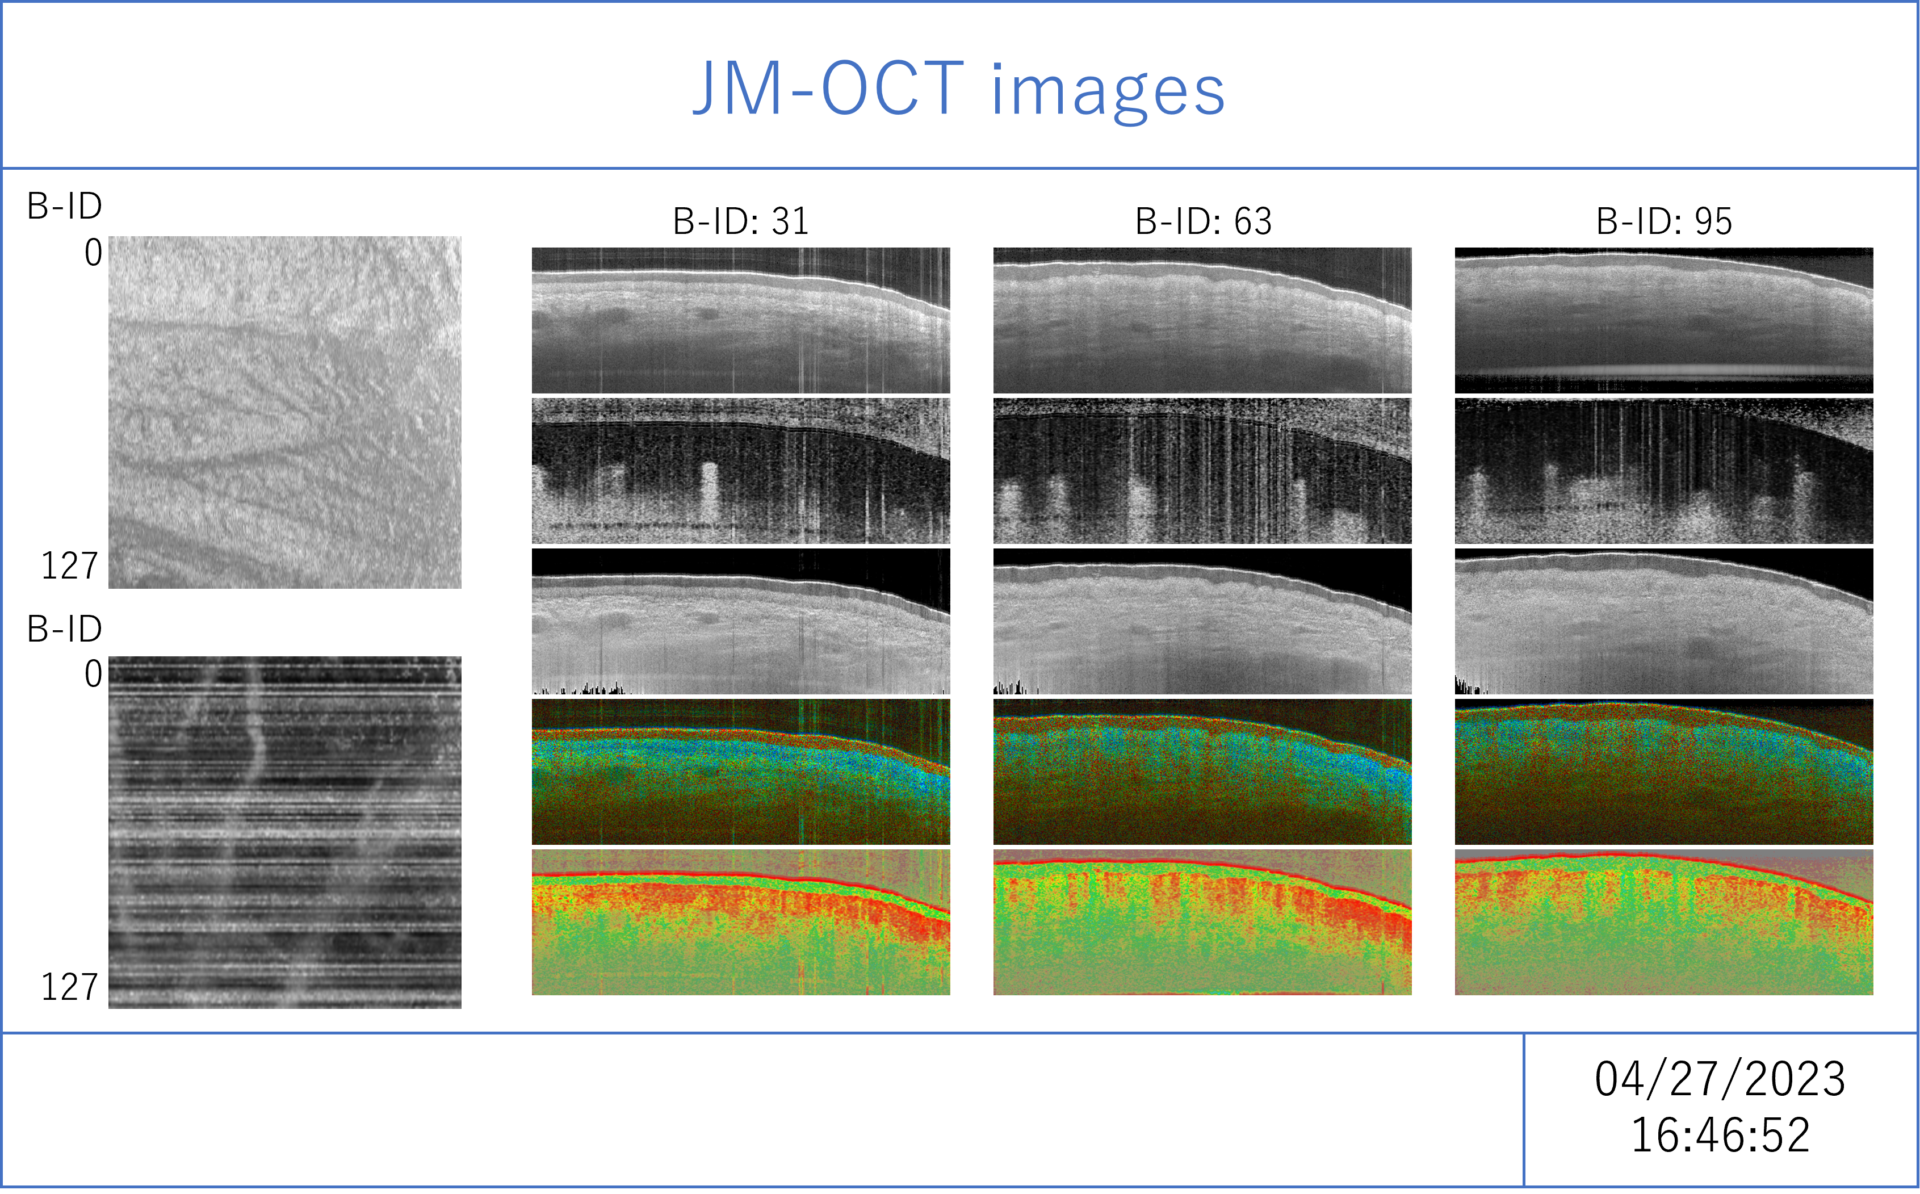
List of JM-OCT images
There are many contrasts in JM-OCT, and opening and checking each file one by one can be a daunting task. By checking the list of each contrast for several positions (automatically generated), you can quickly get an overview of the measurement results.
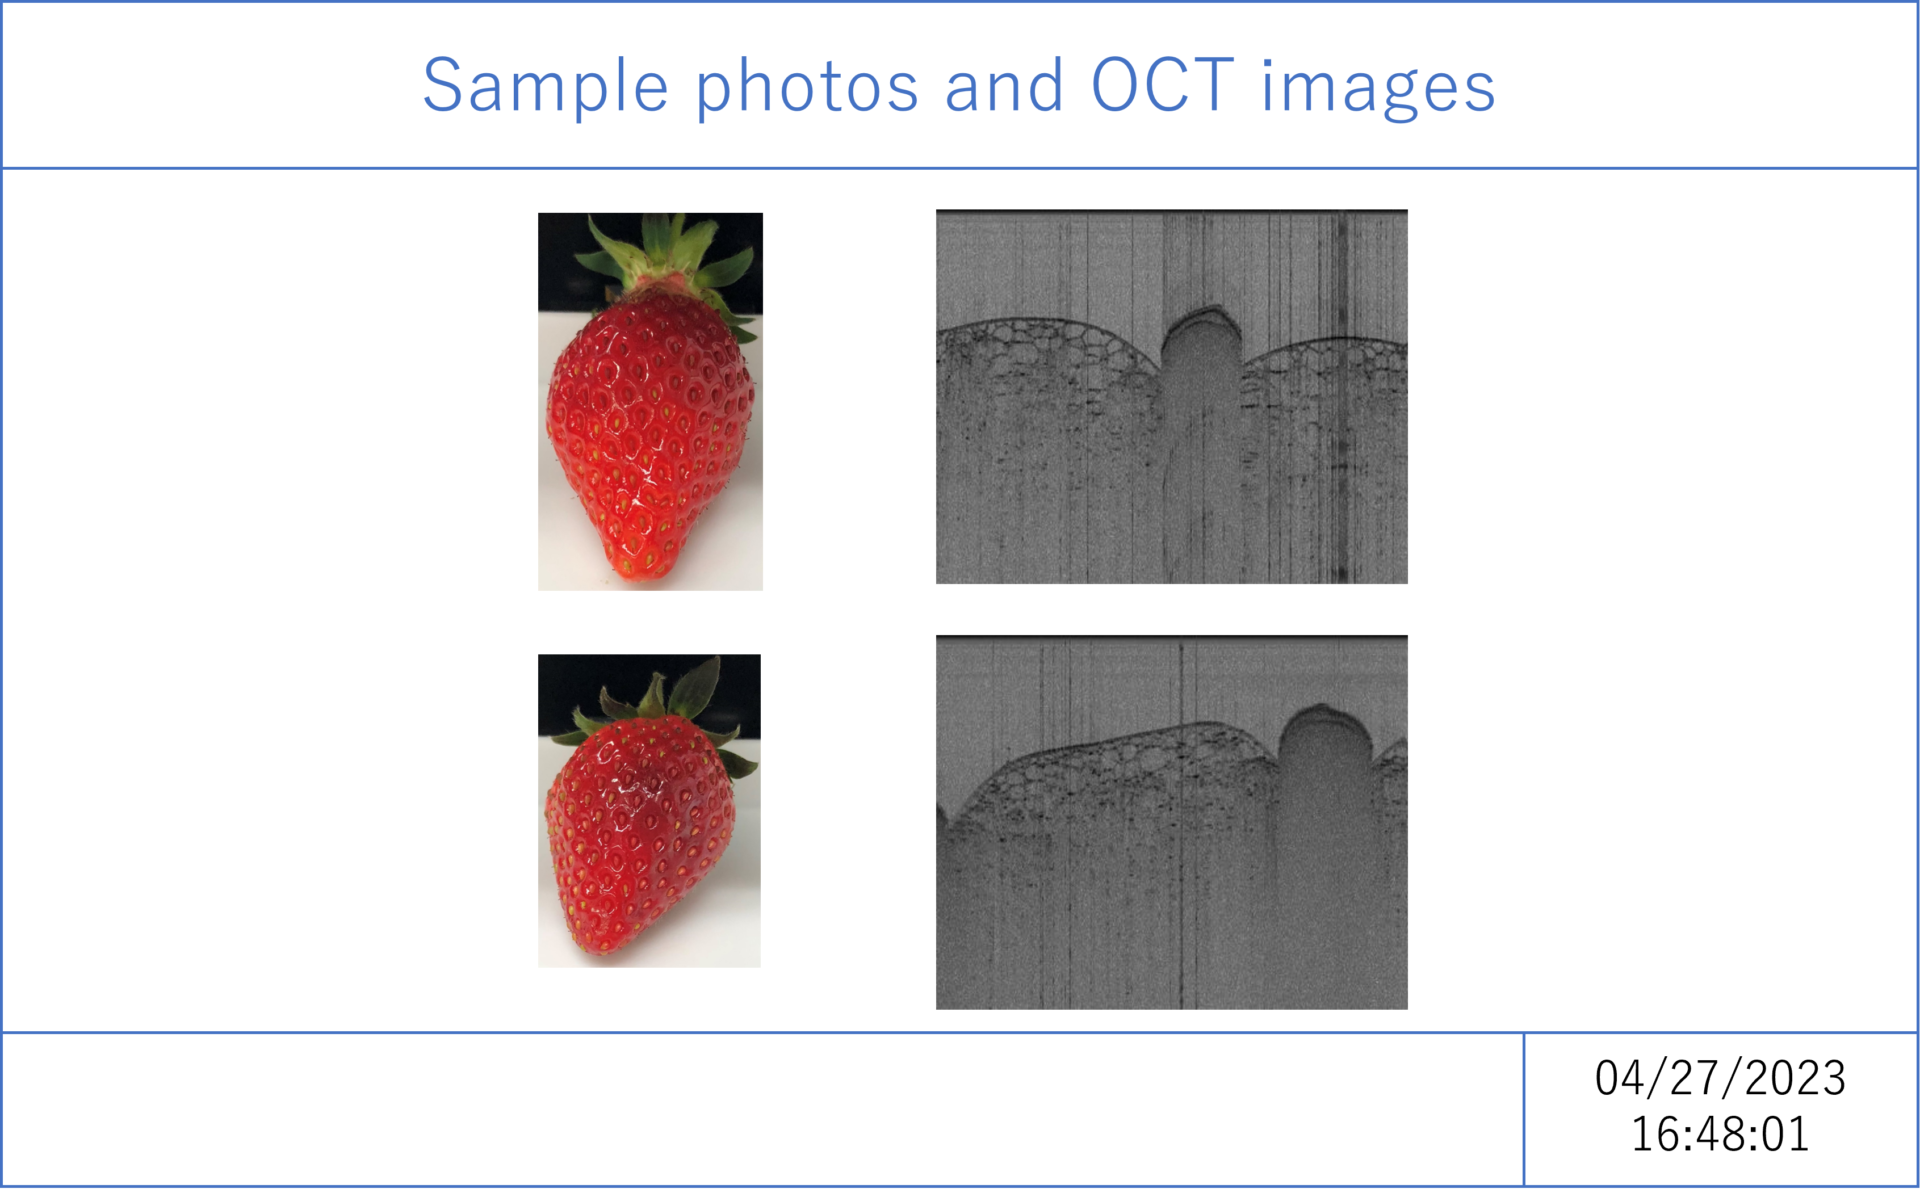
List of sample photos and OCT images
This is a side-by-side list of sample photos (taken separately from the OCT) and the OCT image.
In the strawberry example, the OCT image shows that the cells near the surface are crushed in the areas that have lost water, as can be seen in the photo.
Post-processing software options top